Financial Markets and Valuation MGNT808
Tutorial 3, Week 3
Homework questions.
The required return of a project is 10%, given as an effective annual rate. Assume that the cash flows shown in the table are paid all at once at the given point in time.
What is the Net Present Value (NPV) of the project?
| Project Cash Flows | |
| Time (yrs) | Cash flow ($) |
| 0 | -100 |
| 1 | 0 |
| 2 | 121 |
###\begin{aligned} NPV &= C_0 + \frac{C_2}{(1+r)^2} \\ &= -100 + \frac{121}{(1+0.1)^2} \\ &= -100 + 100 \\ &= 0 \\ \end{aligned}###
What is the Internal Rate of Return (IRR) of the project detailed in the table below?
Assume that the cash flows shown in the table are paid all at once at the given point in time. All answers are given as effective annual rates.
| Project Cash Flows | |
| Time (yrs) | Cash flow ($) |
| 0 | -100 |
| 1 | 0 |
| 2 | 121 |
###\begin{aligned} 0 &= C_0 + \frac{C_2}{(1+r_\text{IRR})^2} \\ &= -100 + \frac{121}{(1+r_\text{IRR})^2} \\ \end{aligned}###
###(1+r_\text{IRR})^2 = \frac{121}{100} ######\begin{aligned} r_\text{IRR} &= \left( \frac{121}{100} \right)^{1/2} - 1 \\ &= 0.1 \\ \end{aligned}###
If a project's net present value (NPV) is zero, then its internal rate of return (IRR) will be:
By definition, the Internal Rate of Return (IRR) is the particular required return that makes the project's Net Present Value (NPV) equal to zero.
###\begin{aligned} NPV &= C_0 + \frac{C_1}{(1+r_\text{required})^1} + \frac{C_2}{(1+r_\text{required})^2} + ... + \frac{C_T}{(1+r_\text{required})^T} \\ 0 &= C_0 + \frac{C_1}{(1+r_{irr})^1} + \frac{C_2}{(1+r_{irr})^2} + ... + \frac{C_T}{(1+r_{irr})^T} \\ \end{aligned} ###
Therefore if the NPV is zero then the IRR must be equal to the required return.
The required return of a project is 10%, given as an effective annual rate.
What is the payback period of the project in years?
Assume that the cash flows shown in the table are received smoothly over the year. So the $121 at time 2 is actually earned smoothly from t=1 to t=2.
| Project Cash Flows | |
| Time (yrs) | Cash flow ($) |
| 0 | -100 |
| 1 | 11 |
| 2 | 121 |
Table method:
| Payback Period Calculation | ||
| Time (yrs) |
Cash flow ($) |
Cumulative cash flow ($) |
| 0 | -100 | -100 |
| 1 | 11 | -89 |
| 2 | 121 | 32 |
The payback period ##T_\text{payback}## is then the time at which the first positive cumulative cash flow occurs, less the cumulative cash flow divided by the single cash flow in that period:
###\begin{aligned} T_\text{payback} &= \left( \begin{array}{c} \text{time of} \\ \text{first positive} \\ \text{cumulative} \\ \text{cash flow} \\ \end{array} \right) - \frac{ \left( \begin{array}{c} \text{first positive} \\ \text{cumulative} \\ \text{cash flow} \\ \end{array} \right) }{ \left( \begin{array}{c} \text{cash flow over} \\ \text{that period} \\ \end{array} \right) } \\ &= 2 - \frac{32}{121} \\ &= 2 - \frac{32}{121} \\ &= 2 - 0.26446281 \\ &= 1.73553719 \text{ yrs} \\ \end{aligned}###
Quick method: A table might be overkill for this simple project, the payback period clearly occurs sometime during the second year (between t=1 and 2), so
###\begin{aligned} T_\text{payback} &= 2 - \frac{-100 + 11 + 121}{121} \\ &= 2 - \frac{32}{121} \\ &= 1.73553719 \text{ yrs} \\ \end{aligned}###
A project has the following cash flows:
| Project Cash Flows | |
| Time (yrs) | Cash flow ($) |
| 0 | -400 |
| 1 | 0 |
| 2 | 500 |
What is the payback period of the project in years?
Normally cash flows are assumed to happen at the given time. But here, assume that the cash flows are received smoothly over the year. So the $500 at time 2 is actually earned smoothly from t=1 to t=2.
To find the payback period,
###\begin{aligned} T_\text{payback} &= \left( \begin{array}{c} \text{time of} \\ \text{first positive} \\ \text{cumulative} \\ \text{cash flow} \\ \end{array} \right) - \frac{ \left( \begin{array}{c} \text{first positive} \\ \text{cumulative} \\ \text{cash flow} \\ \end{array} \right) }{ \left( \begin{array}{c} \text{cash flow over} \\ \text{that period} \\ \end{array} \right) } \\ &= 2 - \frac{(-400+500)}{500} \\ &= 2 - \frac{100}{500} \\ &= 1.8 \\ \end{aligned} ###
The below graph shows a project's net present value (NPV) against its annual discount rate.
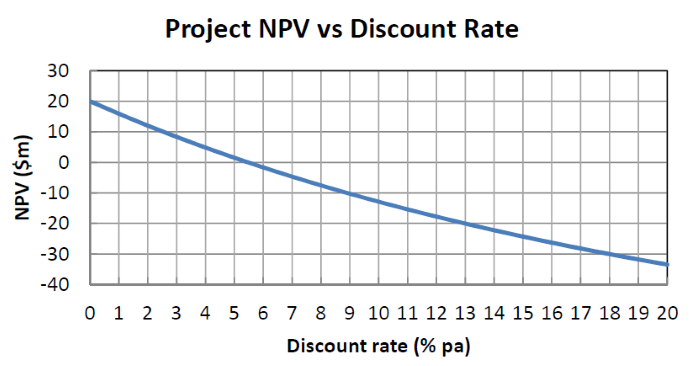
For what discount rate or range of discount rates would you accept and commence the project?
All answer choices are given as approximations from reading off the graph.
Projects add to the firm's asset value if their net present value (NPV) of cash flows is positive, which in this case occurs between the discount rates of zero to five percent. The positive NPV can be seen on the graph where the blue line is above above zero on the vertical y-axis which represents the NPV.
The below graph shows a project's net present value (NPV) against its annual discount rate.
Which of the following statements is NOT correct?
The project's payback period is not infinite, it must be a finite amount of years because when the discount rate is zero, the NPV is $20m as can be seen from the graph. Therefore the sum of the cash flows is positive, so the project must eventually pay itself off.
You have $100,000 in the bank. The bank pays interest at 10% pa, given as an effective annual rate.
You wish to consume an equal amount now (t=0) and in one year (t=1) and have nothing left in the bank at the end (t=1).
How much can you consume at each time?
Let ##C_t## be consumption at time t and ##V_t## be wealth at time t.
Common sense method:
We initially have ##V_0## wealth in the bank. Then we consume or spend ##C_0## a moment later, still at time zero. The amount left in the bank accrues interest so it grows over the next year by the interest rate. To find this future value we multiply by ##(1+r)^1##. At time one, everything that's left in the bank is consumed ##(C_1)## with nothing left over at the end.
###(V_0 -C_0)(1+r)^1 - C_1 = 0 ###| Formula Building Steps | ||
| Time | Event | Formula |
| 0 | Starting wealth | ##V_0## |
| 0 | Consume | ##V_0 - C_0## |
| 1 | Lend to bank for one year | ##(V_0 - C_0)(1+r)^1## |
| 1 | Consume all so there's nothing left | ##(V_0 - C_0)(1+r)^1 - C_1 = 0## |
The question stated that consumption at t=0 and t=1 are equal, so ##C_0 = C_1 ##. So we can solve simultaneously and substitute numbers (k represents thousands),
###(V_0 -C_0)(1+r)^1 - C_1 = 0 ### ###(V_0 -C_0)(1+r)^1 - C_\color{red}{0} = 0 ### ###(100k -C_0)(1+0.1)^1 - C_0 = 0 ### ###100k(1+0.1)^1 -C_0(1+0.1)^1 - C_0 = 0 ### ###C_0\left(1+(1+0.1)^1\right) = 100k(1+0.1)^1 ### ###\begin{aligned} C_0 &= \frac{100k(1+0.1)^1}{1+(1+0.1)^1} \\ &= \frac{100,000 \times 1.1}{2.1} \\ &= 52,380.9524 \\ \end{aligned}### ###C_1 = C_0 = 52,380.9524###Present value method:
This method is easier to formulate. Since all wealth will be consumed, the present value of the positive wealth and negative consumption must equal zero.
###V_0 -C_0 - \frac{C_1}{(1+r)^1} +\frac{V_1}{(1+r)^1} = 0 ###The question stated that consumption at t=0 and t=1 are equal, so ##C_0 = C_1 ##. Also ##V_1 = 0## since there's no wealth left over at the end.
Solving simultaneously and substituting numbers (k represents thousands),
###100k -C_0 - \frac{C_0}{(1+0.1)^1} +\frac{0}{(1+0.1)^1} = 0 ### ###C_0\left(1+ \frac{1}{(1+0.1)^1}\right) = 100k ### ###\begin{aligned} C_0 &= \frac{100k}{\left(1+ \frac{1}{(1+0.1)^1}\right)} \\ &= 52,380.9524 = C_1 \\ \end{aligned}###Future value method:
Similarly to the present value method, this method is easy to formulate. Since all wealth will be consumed, the future value of the positive wealth and negative consumption must equal zero.
###V_0(1+r)^1 -C_0(1+r)^1 - C_1 = 0 ###The question stated that consumption at t=0 and t=1 are equal, so ##C_0 = C_1 ##.
Solving simultaneously and substituting numbers (k represents thousands),
###100k(1+0.1)^1 -C_0(1+0.1)^1 - C_0 = 0 ### ###C_0\left(1+ \frac{1}{(1+0.1)^1}\right) = 100k ### ###C_0 = 52,380.9524 = C_1 ###You have $100,000 in the bank. The bank pays interest at 10% pa, given as an effective annual rate.
You wish to consume an equal amount now (t=0), in one year (t=1) and in two years (t=2), and still have $50,000 in the bank after that (t=2).
How much can you consume at each time?
Let ##C_t## be consumption at time t and ##V_t## be wealth at time t.
Common sense method:
We have ##V_0## in the bank then we consume ##C_0## of that at time zero. The amount left in the bank accrues interest over the year so we grow it by ##(1+r)^1##. Again at time one we consume ##C_1##, and the amount remaining in the bank accrues more interest. At time two we consume ##C_2## and the amount left after this is ##V_2##.
###\left( (V_0 -C_0)(1+r)^1 - C_1 \right)(1+r)^1-C_2 = V_2 ###| Formula Building Steps | ||
| Time | Event | Formula |
| 0 | Starting wealth | ##V_0## |
| 0 | Consume | ##V_0 - C_0## |
| 1 | Lend to bank for one year | ##(V_0 - C_0)(1+r)^1## |
| 1 | Consume more | ##(V_0 - C_0)(1+r)^1 - C_1## |
| 2 | Lend to bank for another year | ##((V_0 - C_0)(1+r)^1 - C_1)(1+r)^1## |
| 2 | Consume again but leave some wealth aside | ##((V_0 - C_0)(1+r)^1 - C_1)(1+r)^1 - C_2 = V_2## |
The question stated that consumption at t=0,1 and 2 are equal, so ##C_0 = C_1 = C_2##.
Solving simultaneously and substituting numbers (k represents thousands),
###\left( (V_0 -C_0)(1+r)^1 - C_1 \right)(1+r)^1-C_2 = V_2 ### ###\left( (100k -C_0)(1+0.1)^1 - C_0 \right)(1+0.1)^1-C_0 = 50k ### ###\begin{aligned} C_0 &= \dfrac{100k(1+0.1)^2 - 50k }{1+(1+0.1)^1 + (1+0.1)^2} \\ &= 21,450.1511 = C_1 = C_2 \\ \end{aligned}###Present value method:
###V_0 -C_0 - \frac{C_1}{(1+r)^1} -\frac{C_2}{(1+r)^2}- \frac{V_2}{(1+r)^2}= 0 ###Also, consumption at t=0, 1 and 2 are all equal, so
###C_0 = C_1 = C_2 ###Solving simultaneously and substituting numbers (k represents thousands),
###100k -C_0 - \frac{C_0}{(1+r)^1} -\frac{C_0}{(1+r)^2} - \frac{50k}{(1+r)^2}= 0 ### ###C_0\left(1+ \frac{1}{(1+0.1)^1} + \frac{1}{(1+0.1)^2}\right) = 100k - \frac{50k}{(1+0.1)^2} ### ###\begin{aligned} C_0 &= \frac{100k - \dfrac{50k}{(1+0.1)^2}}{\left(1+ \dfrac{1}{(1+0.1)^1} + \dfrac{1}{(1+0.1)^2}\right)} \\ &= 21,450.1511 = C_1 = C_2 \\ \end{aligned}###An investor owns an empty block of land that has local government approval to be developed into a petrol station, car wash or car park. The council will only allow a single development so the projects are mutually exclusive.
All of the development projects have the same risk and the required return of each is 10% pa. Each project has an immediate cost and once construction is finished in one year the land and development will be sold. The table below shows the estimated costs payable now, expected sale prices in one year and the internal rates of returns (IRR's).
| Mutually Exclusive Projects | |||
| Project | Cost now ($) |
Sale price in one year ($) |
IRR (% pa) |
| Petrol station | 9,000,000 | 11,000,000 | 22.22 |
| Car wash | 800,000 | 1,100,000 | 37.50 |
| Car park | 70,000 | 110,000 | 57.14 |
Which project should the investor accept?
The best project appears to be the car park because it has the highest IRR. But the other important decision criteria is NPV which isn't calculated. The NPV's are:
###V_\text{0, Petrol station} = -9,000,000 + \dfrac{11,000,000}{(1+0.1)^1} = 1,000,000 ### ###V_\text{0, Car wash} = -800,000 + \dfrac{1,100,000}{(1+0.1)^1} = 200,000 ### ###V_\text{0, Car park} = -70,000 + \dfrac{110,000}{(1+0.1)^1} = 30,000 ###So while the car park has the highest IRR, it has the lowest NPV. The petrol station has the highest NPV, but lowest IRR.
Because the projects are mutually exclusive, only one project can be chosen. Rationally it's best to make the most money and choose the project with the highest NPV. After all, would you prefer to make $30,000 on the car park, or 1 millions of dollars on the petrol station?
An investor owns a whole level of an old office building which is currently worth $1 million. There are three mutually exclusive projects that can be started by the investor. The office building level can be:
- Rented out to a tenant for one year at $0.1m paid immediately, and then sold for $0.99m in one year.
- Refurbished into more modern commercial office rooms at a cost of $1m now, and then sold for $2.4m when the refurbishment is finished in one year.
- Converted into residential apartments at a cost of $2m now, and then sold for $3.4m when the conversion is finished in one year.
All of the development projects have the same risk so the required return of each is 10% pa. The table below shows the estimated cash flows and internal rates of returns (IRR's).
| Mutually Exclusive Projects | |||
| Project | Cash flow now ($) |
Cash flow in one year ($) |
IRR (% pa) |
| Rent then sell as is | -900,000 | 990,000 | 10 |
| Refurbishment into modern offices | -2,000,000 | 2,400,000 | 20 |
| Conversion into residential apartments | -3,000,000 | 3,400,000 | 13.33 |
Which project should the investor accept?
Since the projects are mutually exclusive, the one with the highest NPV ##(V_0)## should be chosen.
###V_\text{0, Rent as is} = -900k + \dfrac{990k}{(1+0.1)^1} = 0### ###V_\text{0, Refurbish into offices} = -2m + \dfrac{2.4m}{(1+0.1)^1} = 0.1818m### ###V_\text{0, Convert to residential} = -3m + \dfrac{3.4m}{(1+0.1)^1} = 0.0909m###The refurbishment into modern offices has the highest NPV, so that's the best option. In this case it also has the highest IRR but that is a co-incidence. The best project is the one which makes the most wealth and that is best decided according to NPV.
Question 579 price gains and returns over time, time calculation, effective rate
How many years will it take for an asset's price to double if the price grows by 10% pa?
Use the 'present value of a single cash flow' formula to find the time taken for the price to double at the capital return of 10% pa.
###P_0 = \dfrac{P_t}{(1+0.1)^t} ###For the price to double, then ##P_{t}## will be twice ##P_0##, so ##P_{t} = 2P_0##. Substitute this into the above equation and solve for the time.
###P_0 = \dfrac{2P_0}{(1+0.1)^t} ### ###1 = \dfrac{2}{(1+0.1)^t} ### ###(1+0.1)^t = 2 ### ###\ln\left((1+0.1)^t\right) = \ln(2) ### ###t.\ln(1+0.1) = \ln(2) ### ###\begin{aligned} t &= \dfrac{\ln(2)}{\ln(1+0.1)} \\ &= 7.272540897 \text{ years} \\ \end{aligned}###Question 580 price gains and returns over time, time calculation, effective rate
How many years will it take for an asset's price to quadruple (be four times as big, say from $1 to $4) if the price grows by 15% pa?
Use the 'present value of a single cash flow' formula to find the time taken for the price to quadruple at the capital return of 15% pa.
###P_0 = \dfrac{P_t}{(1+0.15)^t} ###For the price to quadruple, then ##P_{t}## will be quadruple ##P_0##, so ##P_{t} = 4P_0##. Substitute this into the above equation and solve for the time.
###P_0 = \dfrac{4P_0}{(1+0.15)^t} ### ###1 = \dfrac{4}{(1+0.15)^t} ### ###(1+0.15)^t = 4 ### ###\ln\left((1+0.15)^t\right) = \ln(4) ### ###t.\ln(1+0.15) = \ln(4) ### ###\begin{aligned} t &= \dfrac{\ln(4)}{\ln(1+0.15)} \\ &= 9.918968909 \text{ years} \\ \end{aligned}###You're advising your superstar client 40-cent who is weighing up buying a private jet or a luxury yacht. 40-cent is just as happy with either, but he wants to go with the more cost-effective option. These are the cash flows of the two options:
- The private jet can be bought for $6m now, which will cost $12,000 per month in fuel, piloting and airport costs, payable at the end of each month. The jet will last for 12 years.
- Or the luxury yacht can be bought for $4m now, which will cost $20,000 per month in fuel, crew and berthing costs, payable at the end of each month. The yacht will last for 20 years.
What's unusual about 40-cent is that he is so famous that he will actually be able to sell his jet or yacht for the same price as it was bought since the next generation of superstar musicians will buy it from him as a status symbol.
Bank interest rates are 10% pa, given as an effective annual rate. You can assume that 40-cent will live for another 60 years and that when the jet or yacht's life is at an end, he will buy a new one with the same details as above.
Would you advise 40-cent to buy the or the ✓?
Note that the effective monthly rate is ##r_\text{eff monthly}=(1+0.1)^{1/12}-1=0.00797414##
This is an equivalent annual cost question since the jet and yacht last for different amounts of time.
###\begin{aligned} V_\text{0, jet, all costs} &= -\text{PurchaseCost} -\text{MaintenanceCosts} +\text{SaleRevenue} \\ &= -C_0-\frac{C_\text{monthly}}{r_\text{eff monthly}} \left(1-\frac{1}{(1+r_\text{eff monthly})^{T_\text{months}}} \right) + \frac{C_T}{(1+r_\text{eff monthly})^{T_\text{months}}} \\ &= -6m-\frac{0.012m}{0.00797414} \left(1-\frac{1}{(1+0.00797414)^{12 \times12}} \right) + \frac{6m}{(1+0.00797414)^{12\times12}} \\ &= -5.113583224m \\ \end{aligned} ###
###\begin{aligned} V_\text{0, yacht, all costs} &= -C_0-\frac{C_\text{monthly}}{r_\text{eff monthly}} \left(1-\frac{1}{(1+r_\text{eff monthly})^{T_\text{months}}} \right) + \frac{C_T}{(1+r_\text{eff monthly})^{T_\text{months}}} \\ &= -4m-\frac{0.02m}{0.00797414} \left(1-\frac{1}{(1+0.00797414)^{20 \times12}} \right) + \frac{4m}{(1+0.00797414)^{20\times12}} \\ &= -5.540718655m \\ \end{aligned} ###
Although the jet appears cheaper because it has a lower present value of costs, we have to recognise that the jet has a shorter life than the yacht, so of course the present value of its costs will be less. We need to use the annuity formula to spread the costs over each project's life so we can get an equivalent annual cost.
For the jet,
###V_\text{0, jet, all costs} = \frac{C_\text{EAC jet}}{r_\text{eff annual}} \left(1-\frac{1}{(1+r_\text{eff annual})^{T_\text{years}}} \right) ### ###-5.113583224m = \frac{C_\text{EAC jet}}{0.1} \left(1-\frac{1}{(1+0.1)^{12}} \right) ### ###C_\text{EAC jet} = -0.750486426m ###For the yacht,
###V_\text{0, yacht, all costs} = \frac{C_\text{EAC yacht}}{r_\text{eff annual}} \left(1-\frac{1}{(1+r_\text{eff annual})^{T_\text{years}}} \right) ### ###-5.540718655m = \frac{C_\text{EAC yacht}}{0.1} \left(1-\frac{1}{(1+0.1)^{20}} \right) ### ###C_\text{EAC yacht} = -0.650810734m ###Since the yacht has the lower equivalent annual cost, it is the best choice.
Note that this is a bit of an unusual result since the yacht and jet are both sold for the amount that they are bought for, but the yacht has higher running costs than the jet ($20k vs $12k). Common sense would lead us to conclude that we should buy the thing with the lowest running costs.
But this common-sense approach ignores opportunity costs. The jet costs $2m more than the yacht ($6m vs $4m), and since the interest rate is 10%, that extra $2m means that there is a $200,000 opportunity cost of having that cash tied up in the jet rather than sitting in the bank collecting interest at 10% pa. This is the main reason why the yacht is the more cost-effective choice.
An alternative method to find the equivalent annual cash flow is to use the perpetuity formula to discount the cash flows as if they continue forever. The first step is to find the present value of the cash flows that go forever. Because the cost of the jet (or yacht) is always the same and the sale price at the end of the current jet's life cancels out with the purchase price of the next jet, only the purchase at the very start needs to be included.
###V_\text{0, perpetual} = -C_\text{0, initial cost} - \dfrac{C_\text{1, monthly ongoing costs}}{r_\text{eff monthly}-g_\text{eff monthly}}###For the jet:
###\begin{aligned} V_\text{0, jet, perpetual} &= -6m - \dfrac{0.012m}{0.00797414-0} \\ &= -7.504864474m \\ \end{aligned}###The second step is to spread these costs over each year forever, also using the perpetuity formula.
###V_\text{0, jet, perpetual} = \frac{C_\text{EAC jet}}{r_\text{eff annual} - g_\text{eff anual}} ### ###-7.504864474m = \frac{C_\text{EAC jet}}{0.1 - 0} ### ###\begin{aligned} C_\text{EAC jet} &= -7.504864474m \times 0.1 \\ &= -0.7504864474m \\ \end{aligned}###For the yacht:
###\begin{aligned} V_\text{0, yacht, perpetual} &= -4m - \dfrac{0.02m}{0.00797414-0} \\ &= -6.508107457m \\ \end{aligned}### ###V_\text{0, yacht, perpetual} = \frac{C_\text{EAC yacht}}{r_\text{eff annual} - g_\text{eff anual}} ### ###-6.508107457m = \frac{C_\text{EAC yacht}}{0.1 - 0} ### ###\begin{aligned} C_\text{EAC yacht} &= -6.508107457m \times 0.1 \\ &= -0.6508107457m \\ \end{aligned}###Both equivalent annual cash flows are the same as before, ignoring the small discrepancy caused by rounding the monthly discount rate.
A firm has 1 million shares which trade at a price of $30 each. The firm is expected to announce earnings of $3 million at the end of the year and pay an annual dividend of $1.50 per share.
What is the firm's (forward looking) price/earnings (PE) ratio?
The price to earnings ratio can be calculated as earnings per share (EPS) divided by share price or total earnings (also called net income NI) divided by the market capitalisation of equity (E).
###\text{forward looking PE ratio} = \dfrac{P_0}{\text{EPS}_1} = \dfrac{$30}{$3m/1m} = 10###Estimate Microsoft's (MSFT) share price using a price earnings (PE) multiples approach with the following assumptions and figures only:
- Apple, Google and Microsoft are comparable companies,
- Apple's (AAPL) share price is $526.24 and historical EPS is $40.32.
- Google's (GOOG) share price is $1,215.65 and historical EPS is $36.23.
- Micrsoft's (MSFT) historical earnings per share (EPS) is $2.71.
Source: Google Finance 28 Feb 2014.
The average of Apple and Google's back-looking PE ratio multiplied by Microsft's EPS gives a backward-looking PE multiple valuation of Microsoft's stock price:
###\begin{aligned} P_\text{0,MSFT} &= \dfrac{ \left( \dfrac{P_\text{0,AAPL}}{EPS_\text{0,AAPL}} + \dfrac{P_\text{0,GOOG}}{EPS_\text{0,GOOG}} \right) }{2}.EPS_\text{0,MSFT} \\ &= \dfrac{ \left( \dfrac{526.24}{40.32} + \dfrac{1,215.65}{36.23} \right) }{2} \times 2.71 \\ &= \dfrac{ \left(13.0515873 + 33.55368479 \right) }{2} \times 2.71 \\ &= 23.30263605 \times 2.71 \\ &= 63.15014369 \\ \end{aligned}###Microsoft's share price was actually $38.31 so the PE ratio valuation approach is not doing a good job. This is probably because Google and Apple are not similar enough to Microsoft. Microsoft is an older and more mature company with lower growth prospects than either of the other two software companies.
Estimate the US bank JP Morgan's share price using a price earnings (PE) multiples approach with the following assumptions and figures only:
- The major US banks JP Morgan Chase (JPM), Citi Group (C) and Wells Fargo (WFC) are comparable companies;
- JP Morgan Chase's historical earnings per share (EPS) is $4.37;
- Citi Group's share price is $50.05 and historical EPS is $4.26;
- Wells Fargo's share price is $48.98 and historical EPS is $3.89.
Note: Figures sourced from Google Finance on 24 March 2014.
The average of Citi and Wells Fargo's back-looking PE ratio multiplied by JP Morgan's EPS gives a backward-looking PE multiple valuation of JP Morgan's stock price:
###\begin{aligned} P_\text{0,JPM} &= \dfrac{ \left( \dfrac{P_\text{0,C}}{EPS_\text{0,C}} + \dfrac{P_\text{0,WFC}}{EPS_\text{0,WFC}} \right) }{2}.EPS_\text{0,JPM} \\ &= \dfrac{ \left( \dfrac{50.05}{4.26} + \dfrac{48.98}{3.89} \right) }{2} \times 4.37 \\ &= \dfrac{ \left(11.74882629 + 12.59125964 \right) }{2} \times 4.37 \\ &= 12.17004297 \times 4.37 \\ &= 53.18308776 \\ \end{aligned}###JP Morgan's share price actually closed at $61.07 on 24 March 2014 so the PE ratio valuation approach gives a number in the right ball park.
Since the actual market traded price of $61.07 is higher than the estimated price of $53.18 based on similar firms, JP Morgan stock might be over-priced and therefore should be sold. Or, perhaps JP Morgan has higher expected future growth potential or lower systematic risk compared to its peers so it's fairly priced or even under-priced after taking these factors into account.
Estimate the Chinese bank ICBC's share price using a backward-looking price earnings (PE) multiples approach with the following assumptions and figures only. Note that the renminbi (RMB) is the Chinese currency, also known as the yuan (CNY).
- The 4 major Chinese banks ICBC, China Construction Bank (CCB), Bank of China (BOC) and Agricultural Bank of China (ABC) are comparable companies;
- ICBC 's historical earnings per share (EPS) is RMB 0.74;
- CCB's backward-looking PE ratio is 4.59;
- BOC 's backward-looking PE ratio is 4.78;
- ABC's backward-looking PE ratio is also 4.78;
Note: Figures sourced from Google Finance on 25 March 2014. Share prices are from the Shanghai stock exchange.
ICBC's earnings per share (EPS) multiplied by the average of the other Chinese banks' backward-looking PE ratios gives a backward-looking PE multiple valuation of ICBC's stock price:
###\begin{aligned} P_\text{0,ICBC} &= \dfrac{ \left( \dfrac{P_\text{0,CCB}}{EPS_\text{0,CCB}} + \dfrac{P_\text{0,BOC}}{EPS_\text{0,BOC}} + \dfrac{P_\text{0,ABC}}{EPS_\text{0,ABC}} \right) }{3}.EPS_\text{0,ICBC} \\ &= \dfrac{ \left( \text{PE}_\text{0,CCB} + \text{PE}_\text{0,BOC} + \text{PE}_\text{0,ABC} \right) }{3}.EPS_\text{0,ICBC} \\ &= \dfrac{ \left( 4.59 + 4.78 + 4.78 \right) }{3} \times 0.74\\ &= 4.716666667 \times 0.74 \\ &= 3.490333333 \\ \end{aligned}###ICBC's share price actually closed at RMB3.35 on 25 March 2014 so the PE ratio valuation approach gives a number that's pretty close to the market's valuation.
Since the actual market traded price RMB3.35 is lower than the estimated price of RMB4.49 based on similar firms, ICBC stock might be under-priced and therefore should be bought. Or, perhaps ICBC has lower expected future growth potential or higher systematic risk compared to its peers so it's fairly priced or even over-priced after taking these factors into account.
Private equity firms are known to buy medium sized private companies operating in the same industry, merge them together into a larger company, and then sell it off in a public float (initial public offering, IPO).
If medium-sized private companies trade at PE ratios of 5 and larger listed companies trade at PE ratios of 15, what return can be achieved from this strategy?
Assume that:
- The medium-sized companies can be bought, merged and sold in an IPO instantaneously.
- There are no costs of finding, valuing, merging and restructuring the medium sized companies. Also, there is no competition to buy the medium-sized companies from other private equity firms.
- The large merged firm's earnings are the sum of the medium firms' earnings.
- The only reason for the difference in medium and large firm's PE ratios is due to the illiquidity of the medium firms' shares.
- Return is defined as: ##r_{0→1} = (p_1-p_0+c_1)/p_0## , where time zero is just before the merger and time one is just after.
Say a medium-sized firm makes $1m of earnings (also called profit or net income), then it will trade at a price of $5m since its price-to-earnings ratio is 5.
If lots of these firms are bought, merged and sold off as a large listed company then for each $1m of earnings, the larger firm will trade at a price of $15m since its price-to-earnings ratio is 15.
Therefore each medium-sized firm bought for $5m can be sold sold for $15m once it's merged, making a return of 200%.
###\begin{aligned} r_{0→1} &= \dfrac{p_1-p_0+c_1}{p_0} \\ &= \dfrac{15-5+0}{5} \\ &= 2 = 200\% \\ \end{aligned}###